Reporting Amino Acids
For purified proteins that undergo acid vapor-phase hydrolysis (6 N HCl, Thermo Prod # 24308), we report the analysis of 16 naturally occurring amino acids. Asparagine and Glutamine are deamidated to their respective acids during hydrolysis. They are reported together as ASX and GLX.
Cysteine is destroyed during acid hydrolysis but can be preserved if alkylated prior to hydrolysis. Please make sure you request Cysteine analysis on your sample submittal form if it is important to you. Cysteine analysis will incur an extra charge since it requires a different detector. Also, the alkylating agent affects some of the other amino acids and two separate assays are recommended.
Tryptophan is destroyed during HCl hydrolysis and requires a separate assay and a separate charge (Methansulfonic Acid hydrolysis, Sigma Item # M4141 ). If Tryptophan quantitation is a necessity, call first since the assay requires a larger amount of protein and has a high degree of variability.
Because of its structure, Isoleucine is difficult to hydrolyze and it is not unusual for this amino acid to report lower than expected from the sequence. It is particularly problematic when it is next to another ILE or other beta-branched amino acids in the sequence.
For physiological samples like serum, the 16 naturally occurring amino acids are reported along with Asn, Gln, Cit, B-Ala, Taur, Orn, and Tryp if requested. Tryptophan can be measured in this assay with no extra charge. Cysteine cannot be measured but Cystine can be measured using a different detector. Contact us if Cystine is needed. Please be sure to note amino acids of interest on the request form. Please inquire about other physiological amino acids of interest not listed here.
Solid samples (example: feed or meal samples) are subjected to acid liquid-phase hydrolysis (6 N HCl, Thermo Prod # 24308)
and we will report the 16 naturally occurring amino acids. Cysteine and Trptophan cannot be preserved during this assay and will not be reported.
Results of the assay will be reported in nanomoles, or, for feed samples, micromoles. The assay is calibrated by a standard (Agilent #5061‐3331) which undergoes the same treatment as the samples and control, including hydrolysis. Usually two standards of 5 nanomoles each are averaged and the origin is used as the other point to construct a line. Two internal standards Norvaline, Sigma # N7502 (for primary amino acids) and Sarcosine, Sigma S7672 (for secondary amino acids) are added at the beginning of the assay to all samples, standards, controls and blanks. These Internal Standards control errors due to sample loss, injection variations and variability in preparing dilutions.
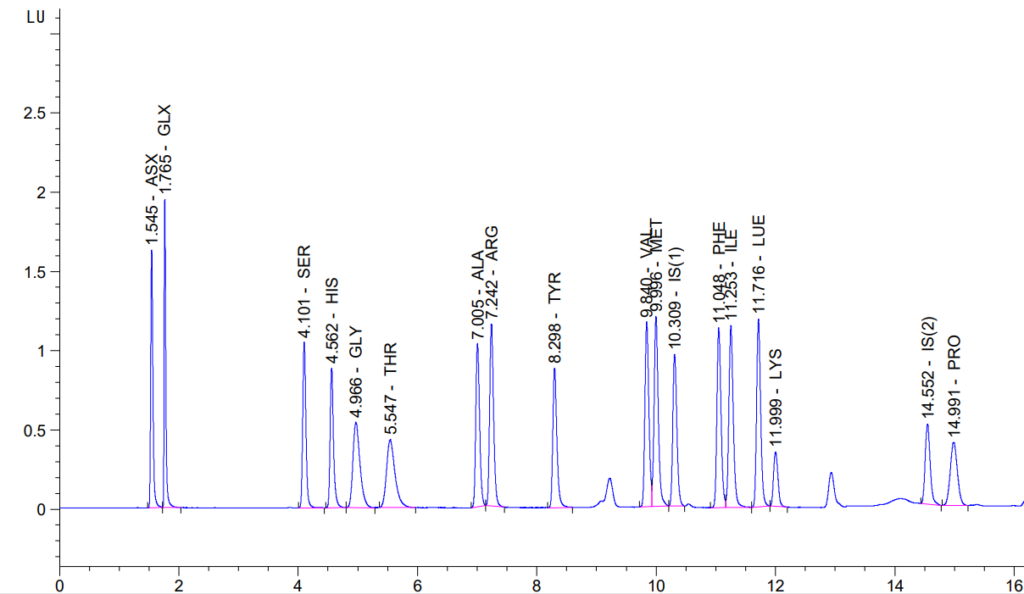
Standard amino acids elute at discrete retention times in the working portion of the chromatogram and the ChemStation® software integrates the area under the peak of the amino acid and compares it to the area under the peak of its Internal Standard. A line is generated by linear regression. Amino acids of unknown amount in the sample are also ratioed to their Internal Standards and their amounts are calculated by the formula: y = mx + b.
Although the assay is quite linear up to 8,000 nanomoles per amino acid (R>0.96) we prefer to manage the sample such that the contents fall close to the 5 nanomole standards.
The assay is controlled by a known protein, a recombinant Human Serum Albumin (Pro-Spec-TanyTechnoGene #pro-595). An aliquot from the same batch of HSA is run with every assay. The data from these controls is used to calculate the inter-assay error of all the amino acids. When an amino acid in the control falls more than 3 standard deviations from the mean, the assay is repeated. Occasionally, if for some reason, the assay cannot be repeated, the amino acid(s) that falls out of range in the control is noted on the control and on the samples.
Every assay has a reagent blank run with it. The reagent blank undergoes all the steps that all other samples and standards undergo. Reagent blanks control for background in the assay itself. If an investigator has reason to believe that his sample buffers might be high in contaminating amino acids (usually GLY, SER and ALA), he can send a matrix blank which we will run for no charge along with the samples. Reagent blanks are not subtracted from the samples since the background will be accounted for in the standards. However, it might be useful to subtract matrix blanks from sample amounts in some cases where buffer contamination is a problem.
We define the detection limit as a Signal/Noise ratio of 4 and the quantitation limit as a Signal/Noise ratio of 8. One must keep in mind that each amino acid has unique properties and will have slightly different limits. The limit of detection by the UV detector for the “typical” amino acid is 100 picomoles, and for the Flourometric detector, 0.2 picomoles. The limits of quantitation are 0.8 nanomoles and 1.6 picomoles respectively. Amino acids that have much higher detection thresholds are Histidine (a low response factor) and Cysteine and Lysine that are not well seen by flourometry due to quench.
Although detection and quantitation are possible at these very low levels, standard error is usually too high to pass confidence limits. More importantly, background levels, especially for GLY, SER and ALA are usually higher than the sample amounts.
Samples that are carefully prepared and contain a marker amino acid that is not one of the usual contaminants can sometimes be successfully analyzed at very low levels, but usually, it is not possible to get meaningful data on less than 1 microgram of protein.
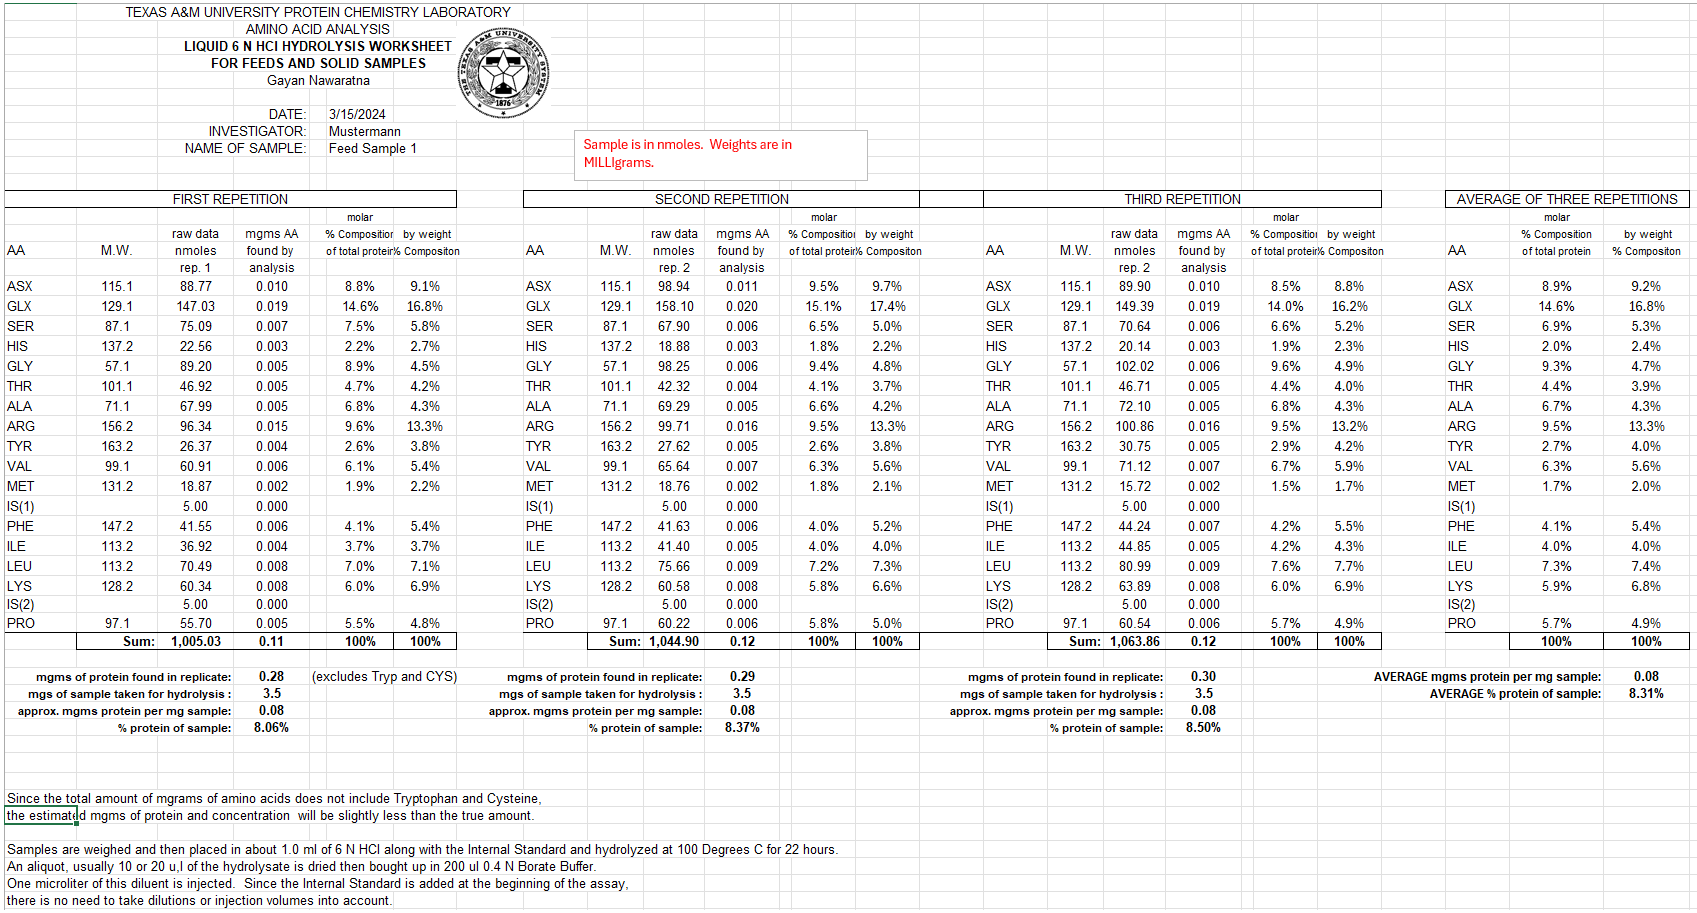
Assay results are exported to a Microsoft Excel Workbook where the data is further treated. In the Workbook, replicates are averaged, percent composition is calculated, and amount of sample found in the aliquot is calculated in several ways. If the molecular weight and sequence is given, the amount can be calculated in nanomoles of protein and the known molar percent composition can be compared to that reported by the assay. The Workbook also contains the results of the HSA control for that assay. On this page, the client can see, not only the control results, but also the historical data from many controls. This data gives a good idea of the different standard errors among the various amino acids. The Workbook is sent electronically to the investigator not only because of timeliness, but also because the workbook is “live” and can be used for further custom calculations.
The raw data (chromatograms and reports) are sent in the mail to the investigator for archival. The PCL keeps an electronic copy of the raw data for 1 year and keeps the data summary in the Workbook for 3 years.
The PCL recommends that samples are run at least in duplicate. For compositional studies, this is usually enough. For quantitation, where accuracy is important, we recommend that samples are run in triplicate. However, there is a price differential for duplicates and triplicates and it is at the discretion of the investigator to let us know which she/he prefers. Click HERE for price structure for TAMU users. Click HERE for academic users from other academic institutions. Click HERE for commercial prices.